 www.geodatenkatalog.de (S3L)
Keyword
Change Detection
3 record(s)
Provided by
Type of resources
Available actions
Topics
Keywords
Contact for the resource
Update frequencies
-
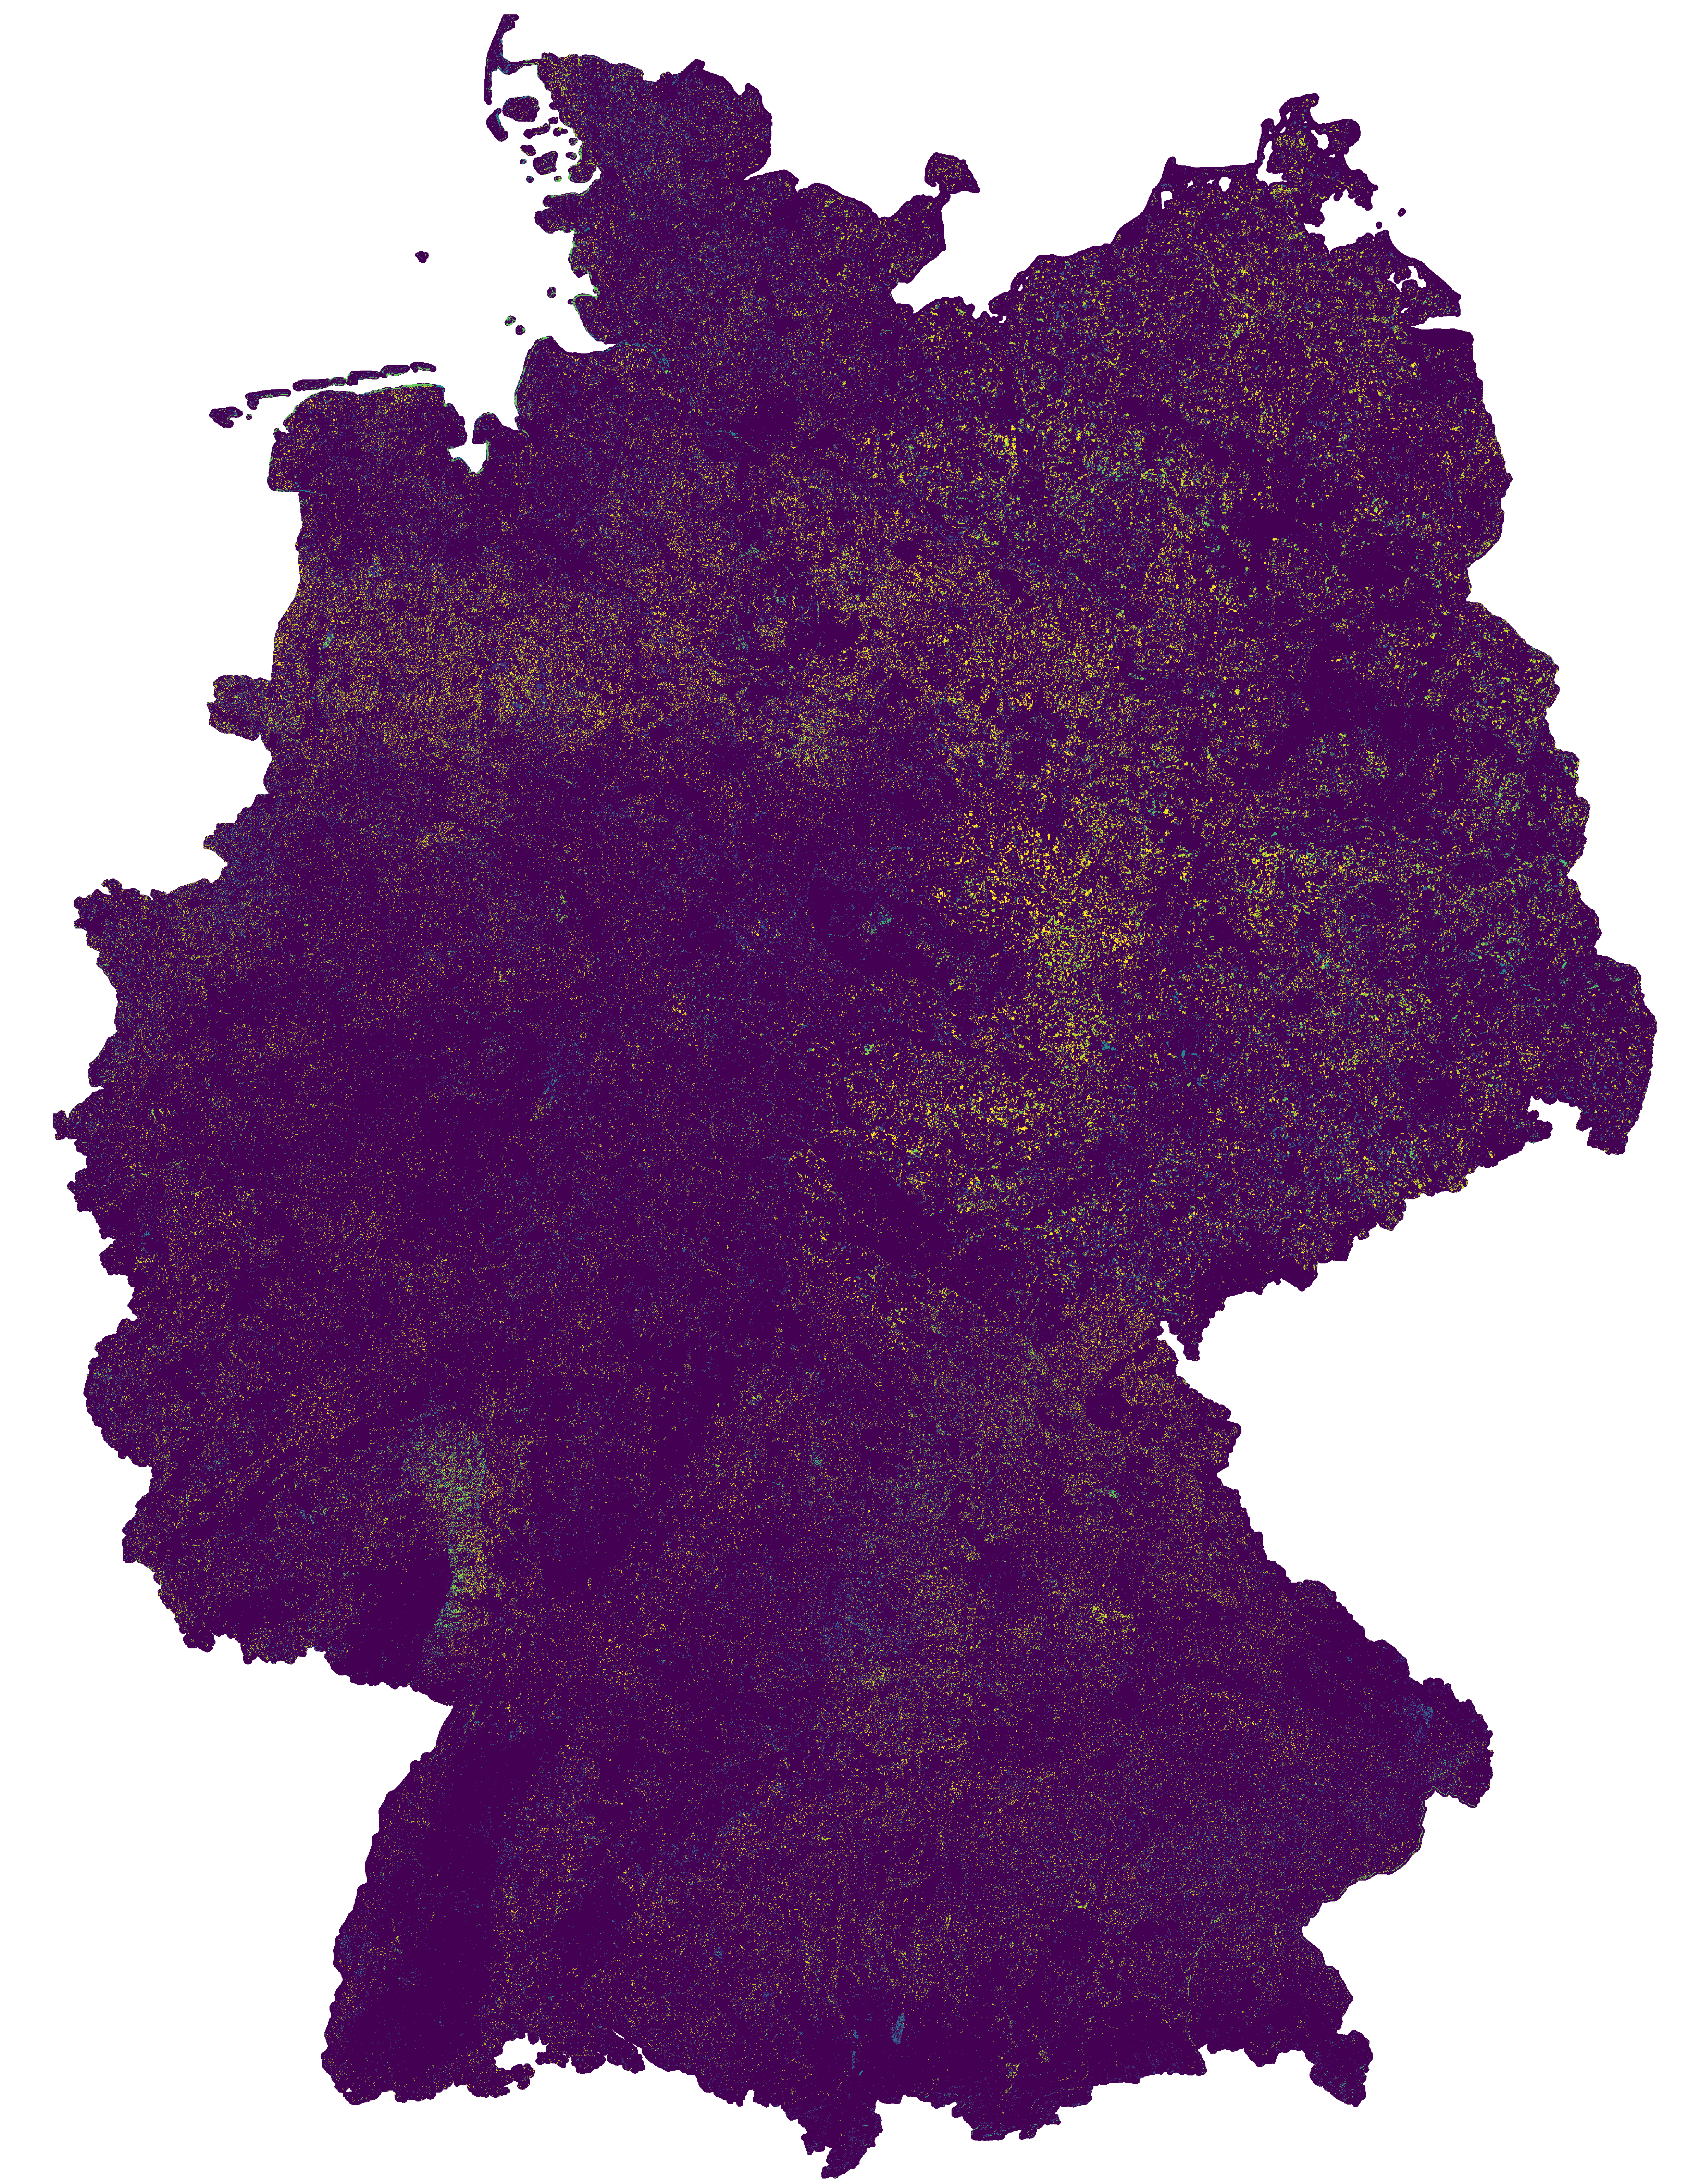
This change map was produced as an intermediate result in the course of the project incora (Inwertsetzung von Copernicus-Daten für die Raumbeobachtung, mFUND Förderkennzeichen: 19F2079C) in cooperation with ILS (Institut für Landes- und Stadtentwicklungsforschung gGmbH) and BBSR (Bundesinstitut für Bau-, Stadt- und Raumforschung) funded by BMVI (Federal Ministry of Transport and Digital Infrastructure). The goal of incora is an analysis of settlement and infrastructure dynamics in Germany based on Copernicus Sentinel data. The map indicates land cover changes between the years 2016 and 2019. It is a difference map from two classifications based on Sentinel-2 MAJA data (MAJA L3A-WASP: https://geoservice.dlr.de/web/maps/sentinel2:l3a:wasp; DLR (2019): Sentinel-2 MSI - Level 2A (MAJA-Tiles)- Germany). More information on the two basis classifications can be found here: https://data.mundialis.de/geonetwork/srv/eng/catalog.search#/metadata/db130a09-fc2e-421d-95e2-1575e7c4b45c https://data.mundialis.de/geonetwork/srv/eng/catalog.search#/metadata/36512b46-f3aa-4aa4-8281-7584ec46c813 To keep only significant changes in the change detection map, the following postprocessing steps are applied to the initial difference raster: - Modefilter (3x3) to eliminate isolated pixels and edge effects - Information gain in a 4x4 window compares class distribution within the window from the two timesteps. High values indicate that the class distribution in the window has changed, and thus a change is likely. Gain ranges from 0 to 1, all changes < 0.5 are omitted. - Change areas < 1ha are removed The resulting map has the following nomenclature: 0: No Change 1: Change from low vegetation to forest 2: Change from water to forest 3: Change from built-up to forest 4: Change from bare soil to forest 5: Change from agriculture to forest 6: Change from forest to low vegetation 7: Change from water to low vegetation 8: Change from built-up to low vegetation 9: Change from bare soil to low vegetation 10: Change from agriculture to low vegetation 11: Change from forest to water 12: Change from low vegetation to water 13: Change from built-up to water 14: Change from bare soil to water 15: Change from agriculture to water 16: Change from forest to built-up 17: Change from low vegetation to built-up 18: Change from water to built-up 19: Change from bare soil to built-up 20: Change from agriculture to built-up 21: Change from forest to bare soil 22: Change from low vegetation to bare soil 23: Change from water to bare soil 24: Change from built-up to bare soil 25: Change from agriculture to bare soil 26: Change from forest to agriculture 27: Change from low vegetation to agriculture 28: Change from water to agriculture 29: Change from built-up to agriculture 30: Change from bare soil to agriculture - Contains modified Copernicus Sentinel data (2016/2019), processed by mundialis Incora report with details on methods and results: pending
-
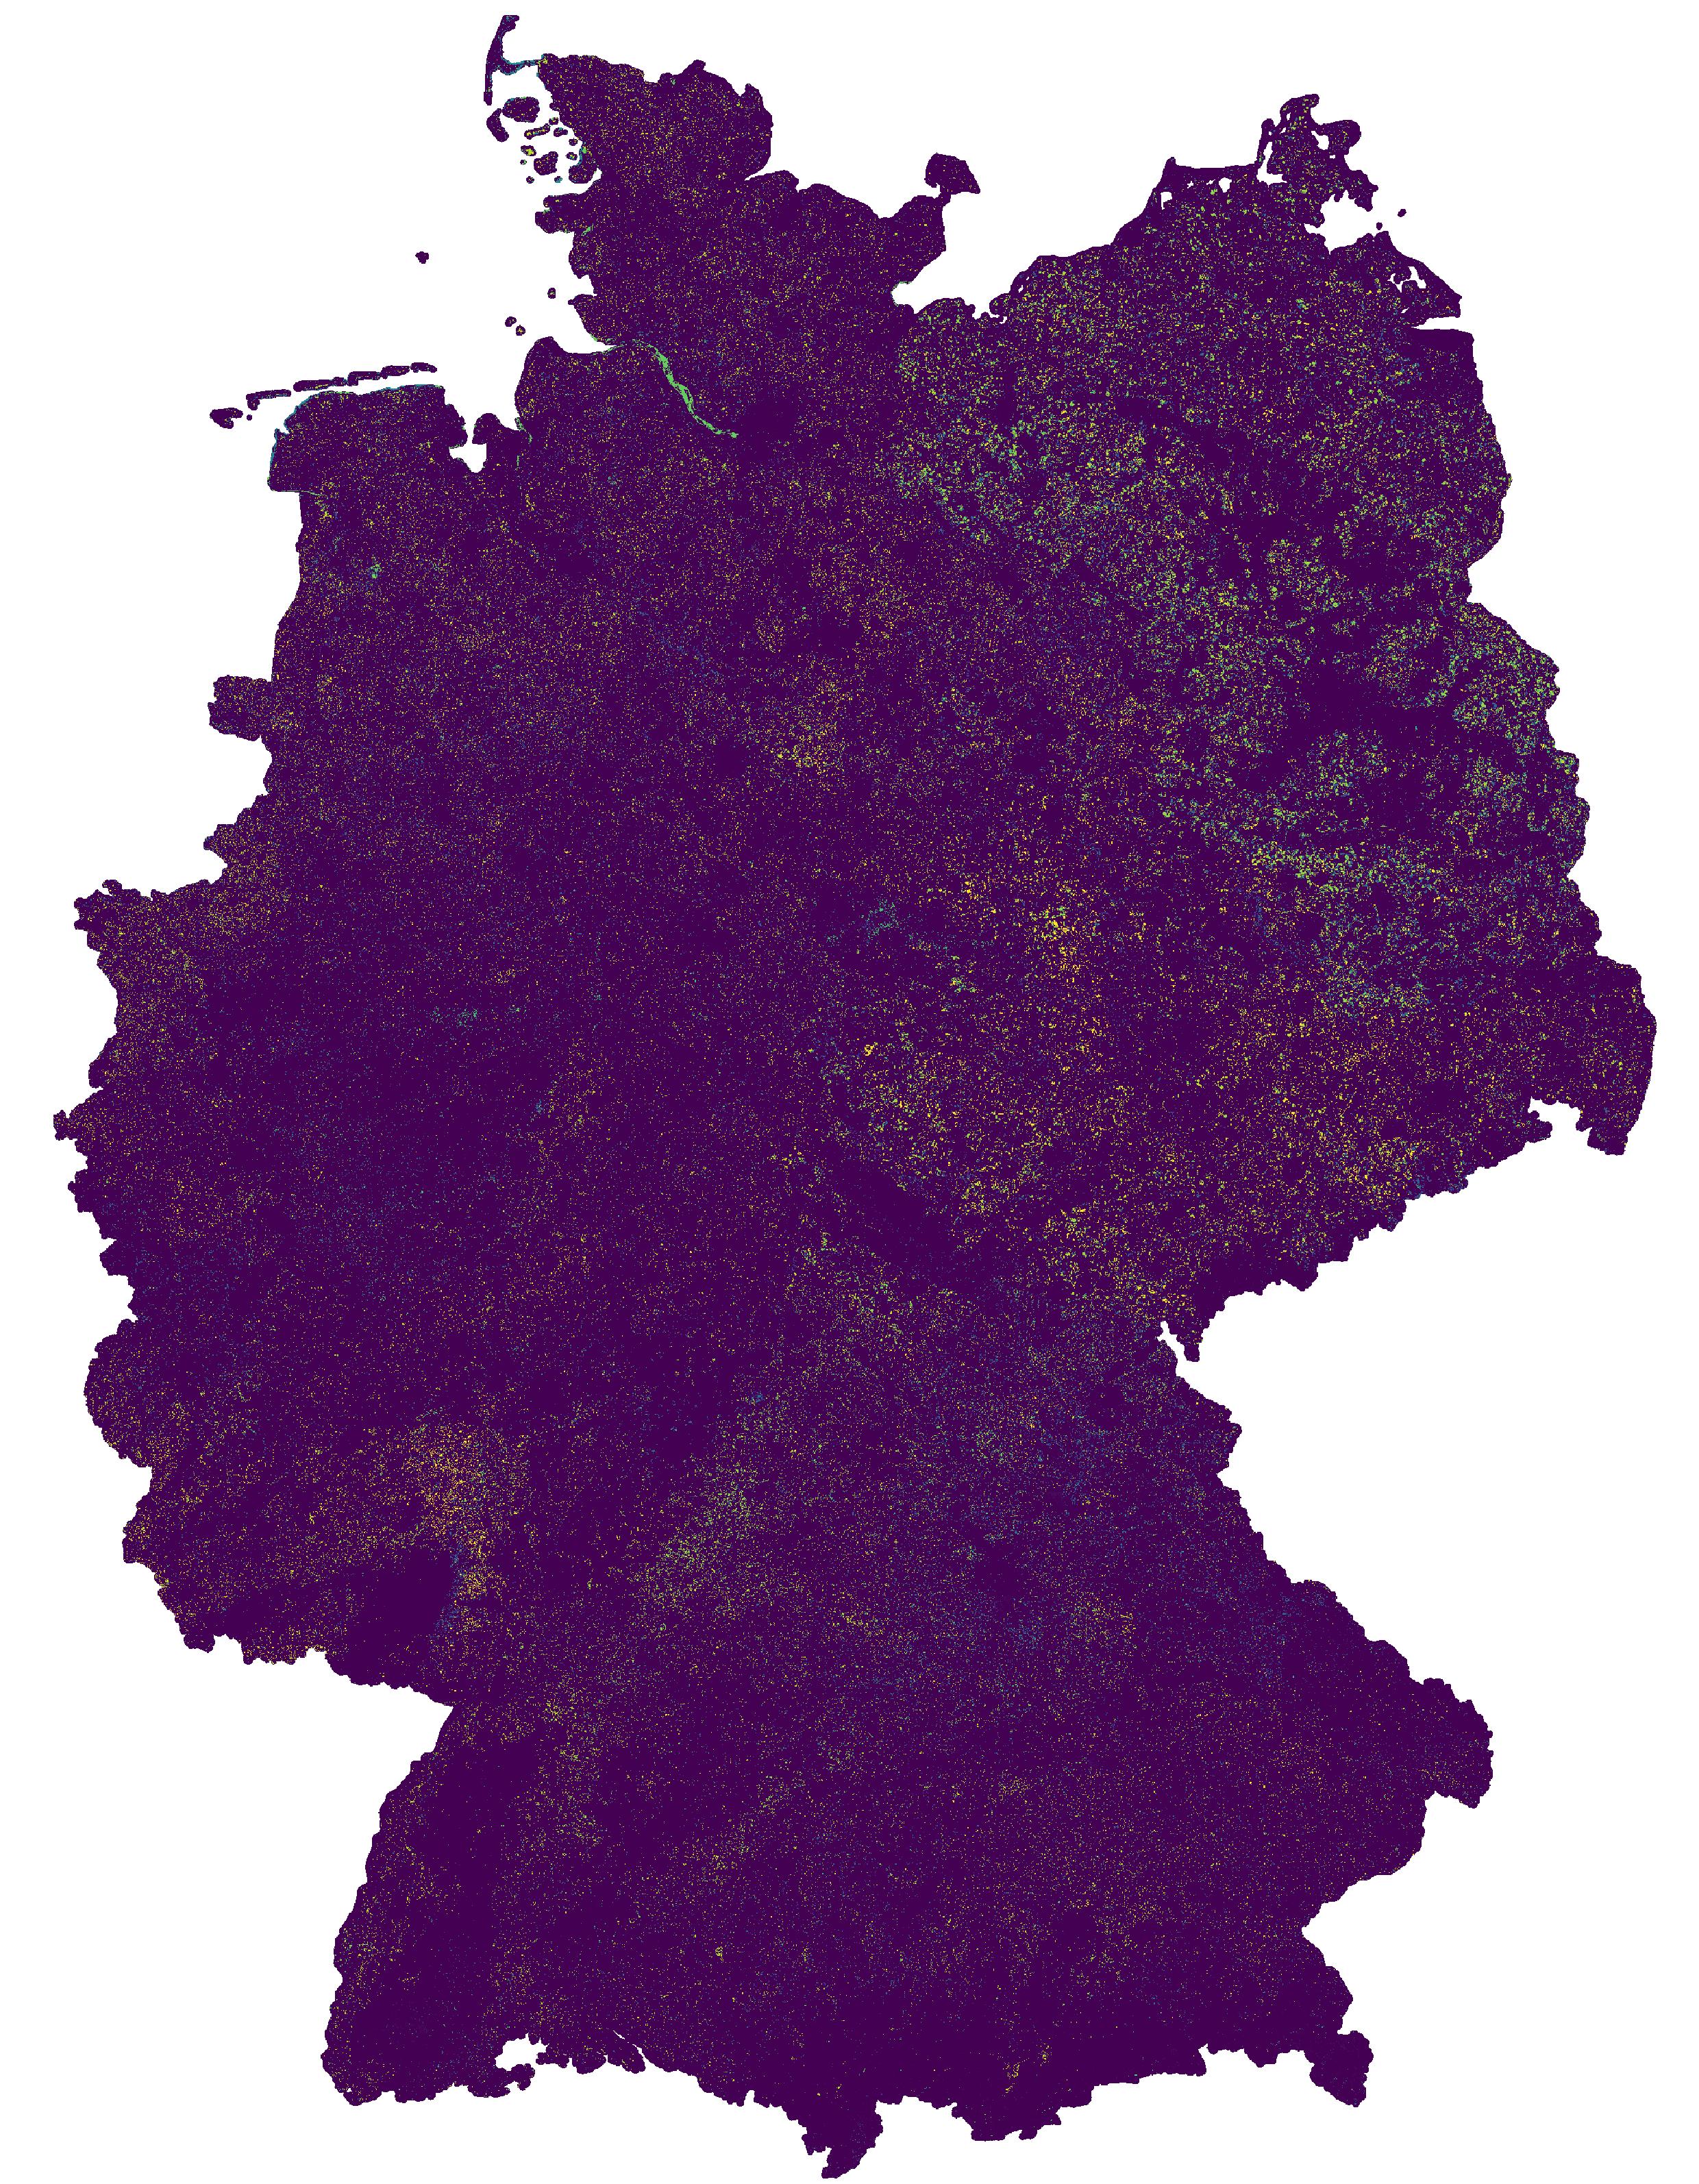
This change map was produced on the basis of a classification method developed in the project incora (Inwertsetzung von Copernicus-Daten für die Raumbeobachtung, mFUND Förderkennzeichen: 19F2079C) in cooperation with ILS (Institut für Landes- und Stadtentwicklungsforschung gGmbH) and BBSR (Bundesinstitut für Bau-, Stadt- und Raumforschung) funded by BMVI (Federal Ministry of Transport and Digital Infrastructure). The goal of incora is an analysis of settlement and infrastructure dynamics in Germany based on Copernicus Sentinel data. The map indicates land cover changes between the years 2019 and 2020. It is a difference map from two classifications based on Sentinel-2 MAJA data (MAJA L3A-WASP: https://geoservice.dlr.de/web/maps/sentinel2:l3a:wasp; DLR (2019): Sentinel-2 MSI - Level 2A (MAJA-Tiles)- Germany). More information on the two basis classifications can be found here: https://data.mundialis.de/geonetwork/srv/eng/catalog.search#/metadata/36512b46-f3aa-4aa4-8281-7584ec46c813 https://data.mundialis.de/geonetwork/srv/eng/catalog.search#/metadata/9246503f-6adf-460b-a31e-73a649182d07 To keep only significant changes in the change detection map, the following postprocessing steps are applied to the initial difference raster: - Modefilter (3x3) to eliminate isolated pixels and edge effects - Information gain in a 4x4 window compares class distribution within the window from the two timesteps. High values indicate that the class distribution in the window has changed, and thus a change is likely. Gain ranges from 0 to 1, all changes < 0.5 are omitted. - Change areas < 1ha are removed The resulting map has the following nomenclature: 0: No Change 1: Change from low vegetation to forest 2: Change from water to forest 3: Change from built-up to forest 4: Change from bare soil to forest 5: Change from agriculture to forest 6: Change from forest to low vegetation 7: Change from water to low vegetation 8: Change from built-up to low vegetation 9: Change from bare soil to low vegetation 10: Change from agriculture to low vegetation 11: Change from forest to water 12: Change from low vegetation to water 13: Change from built-up to water 14: Change from bare soil to water 15: Change from agriculture to water 16: Change from forest to built-up 17: Change from low vegetation to built-up 18: Change from water to built-up 19: Change from bare soil to built-up 20: Change from agriculture to built-up 21: Change from forest to bare soil 22: Change from low vegetation to bare soil 23: Change from water to bare soil 24: Change from built-up to bare soil 25: Change from agriculture to bare soil 26: Change from forest to agriculture 27: Change from low vegetation to agriculture 28: Change from water to agriculture 29: Change from built-up to agriculture 30: Change from bare soil to agriculture - Contains modified Copernicus Sentinel data (2019/2020), processed by mundialis Incora report with details on methods and results: pending
-
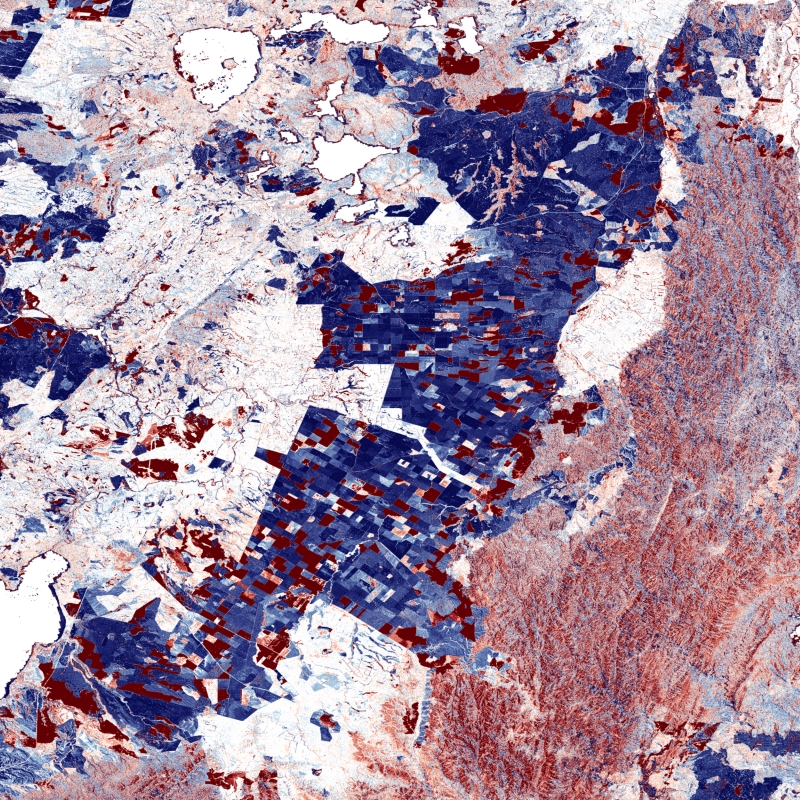
The TanDEM-X DEM Change Maps is a project developed by the Institute Remote Sensing Technology (IMF) at the German Aerospace Center (DLR) within the activities of the TanDEM-X Mission. Between 2016 and 2022, the TanDEM-X mission acquired an additional complete coverage of the Earth's landmass to deliver a temporally independent coverage within a well-defined time span. These new acquisitions not only provide more up-to-date elevation information, but also a great dataset to show the changes that have occurred during the years separating this new coverage from the coverages acquired to generate the TanDEM-X global DEM (between 2011 and 2014). This product - the TanDEM-X 30 m DEM Change Maps - shows the changes between the edited first global TanDEM-X DEM (TanDEM-X 30m Edited DEM) and the newly acquired time-tagged DEM scenes. In order to keep a unique timestamp, two change maps are available per tile: one with the change to the oldest pixel in the new dataset - the first DEM change, and another with the change to the newest pixel of the new dataset - the last DEM change. The two maps differ only when there are multiple coverages. Users must be aware that a given elevation change measured in the DEM change maps corresponds to a topographic change with respect to TanDEM-X 30m EDEM, but cannot be associated with a corresponding physical height change of the same magnitude. This is due to the fact that the global TanDEM-X DEM reflects an averaged elevation derived from the combination of different images, acquired over a period of several years but also because the radar waves penetrate differently in the surface depending on the attributes of the land cover. This is especially important over vegetated and snow-covered regions.